(Guidance Programme) Combined Graduate Level Exam - Tier - I : Bar Graph
Bar Charts
Quantities can be compared by the height or length of a bar in a bar graph. A
bar graph can have either vertical or horizontal bars. You can compare different
quantities or the same quantity at different times.
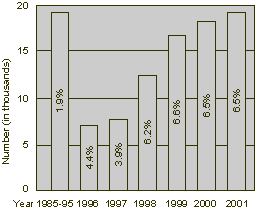
Disability Beneficiaries Reported as Rehabilitated
(Number, as percent of all rehabilitated clients of state
vocational rehabilitation agencie, years 1985-2001)


